The answers your spreadsheet
couldn’t give you.
FeltIQ turns a pile of sessions into the metrics that actually change how you play — your true hourly, your best and worst spots, and how much variance you should expect along the way.
- BB/hour & ROI
- 7 breakdowns
- Risk of ruin
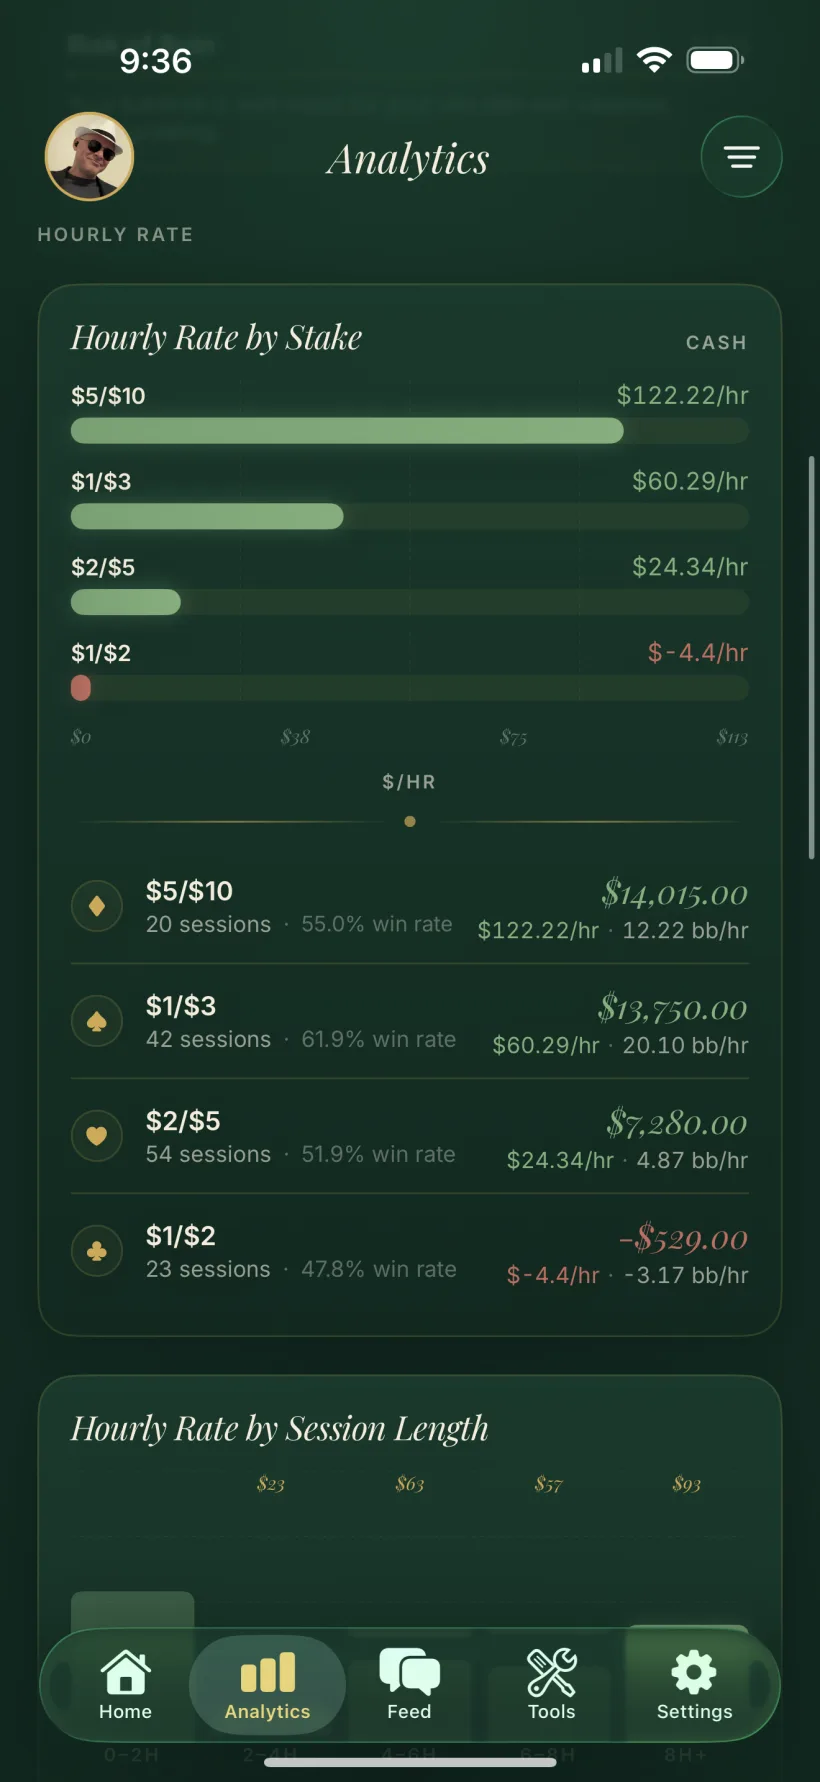
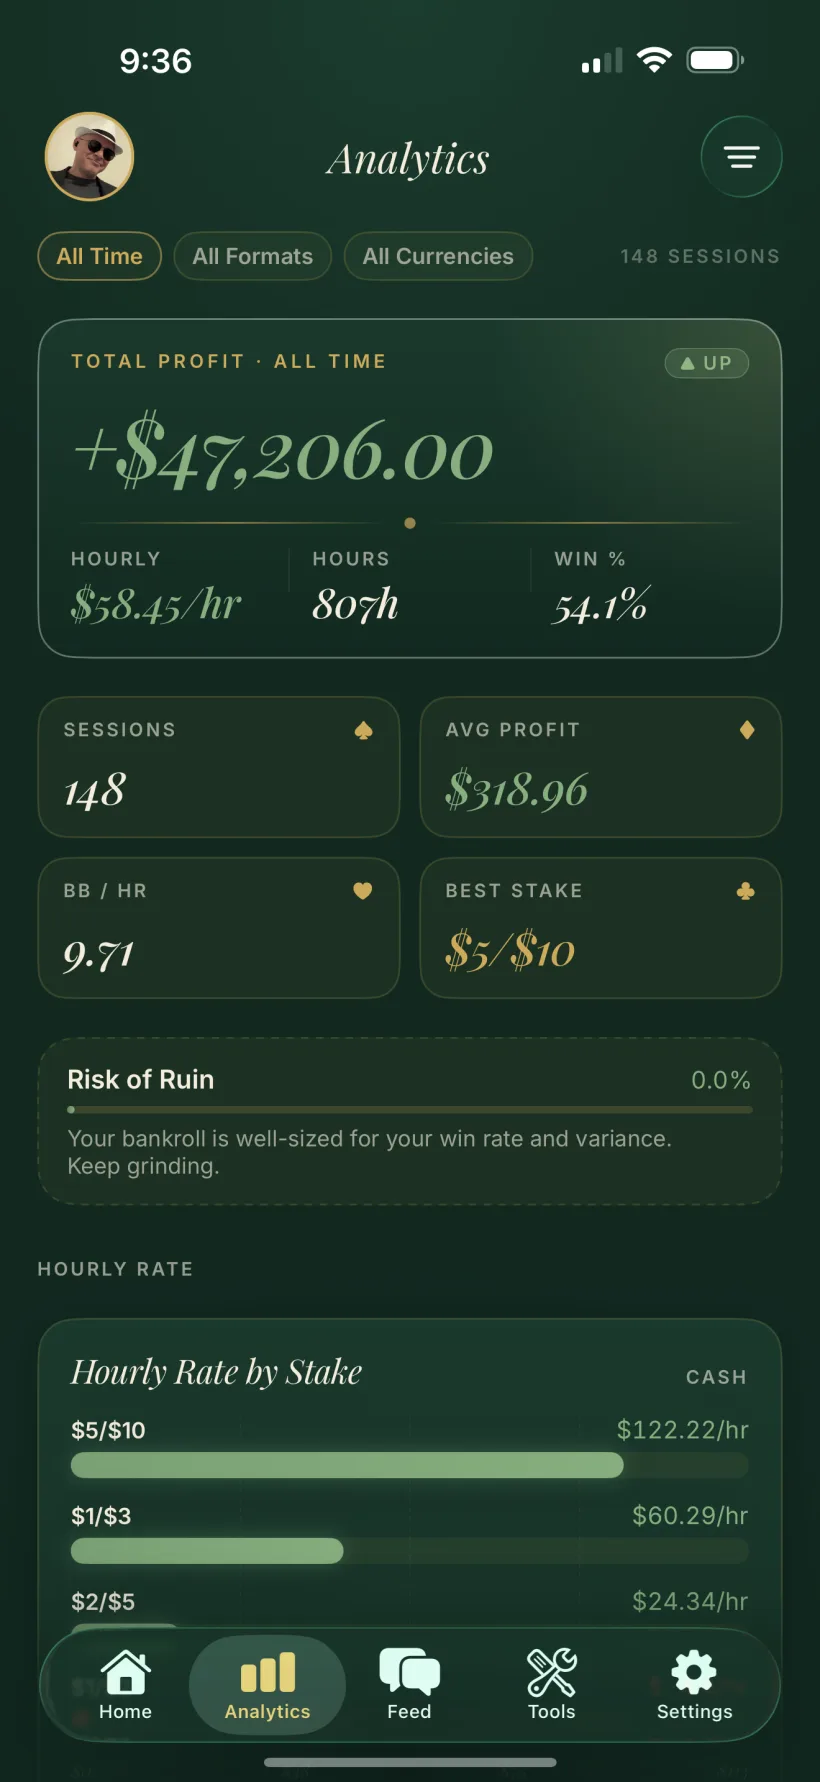
The metrics that matter, computed for you.
Real hourly. Total profit over real playing time — breaks excluded — not time sat at the table.
BB / hour. Win rate in big blinds per hour across your cash sessions, the way live players actually measure.
ROI & ITM. For tournaments: return on buy-ins and how often you finish in the money.
Win rate & averages. Share of winning sessions, average result, total hours, and sample size at a glance.
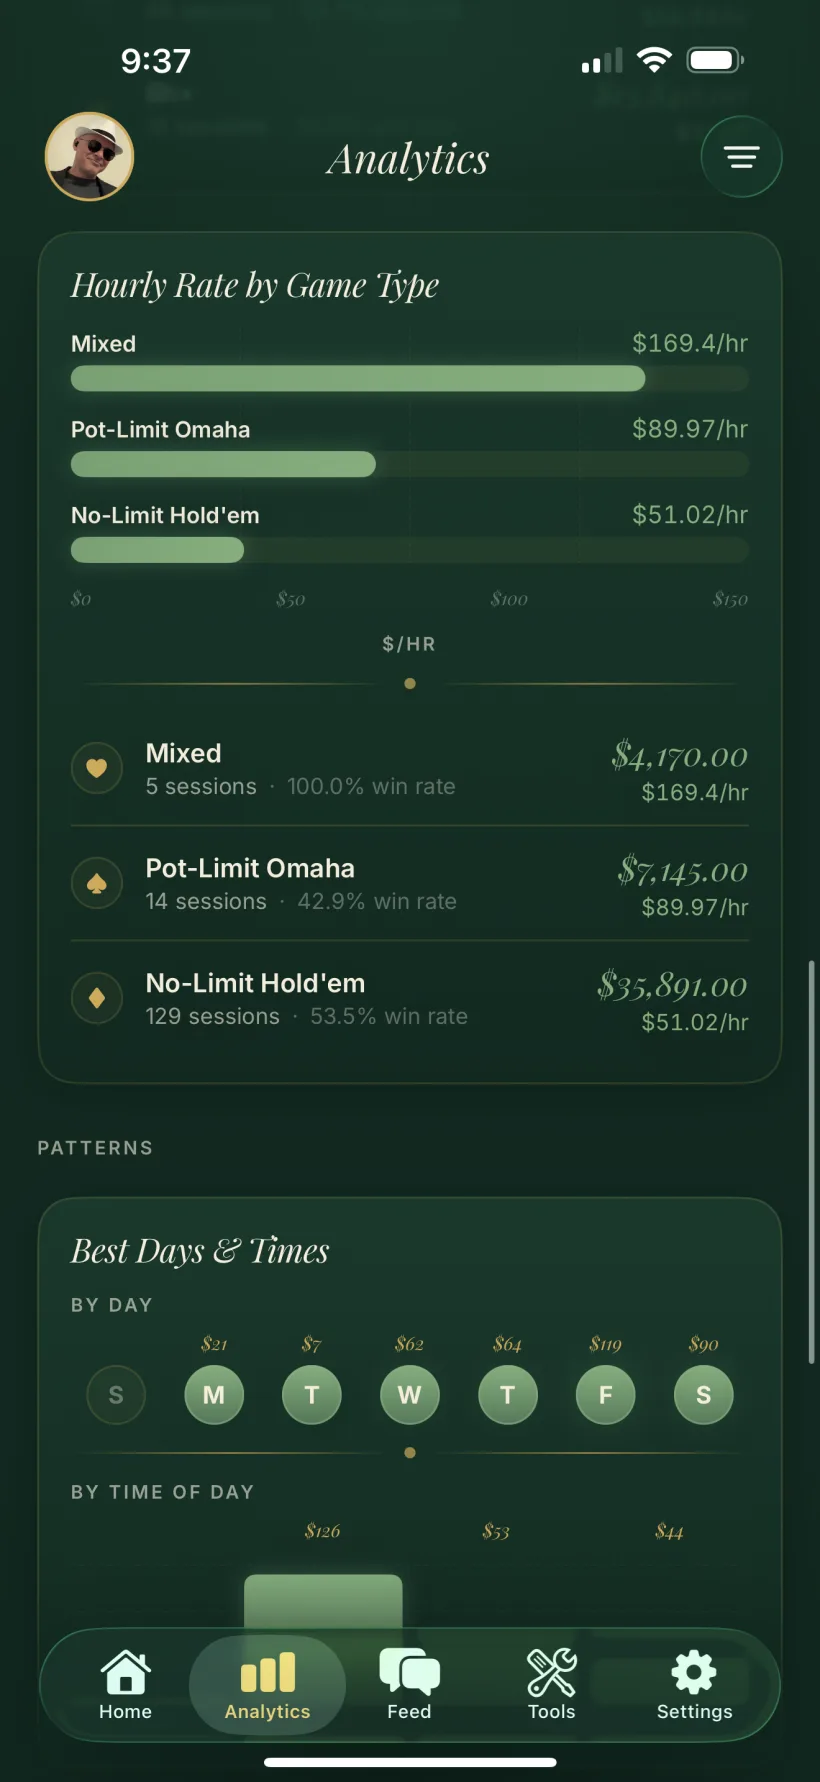
Slice it however you think about the game.
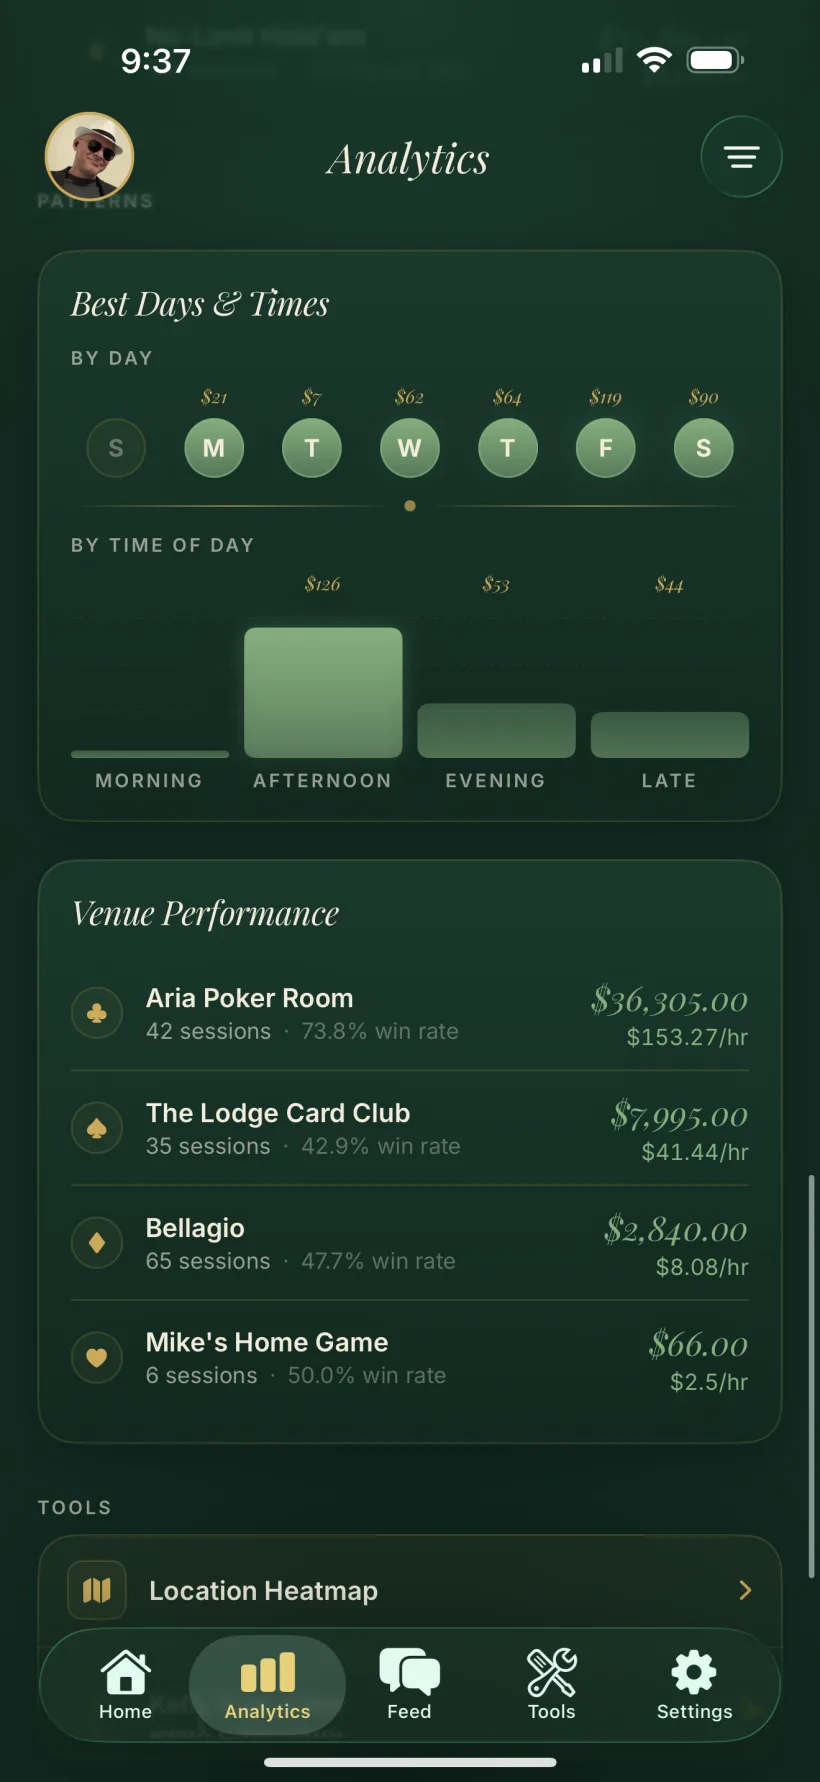
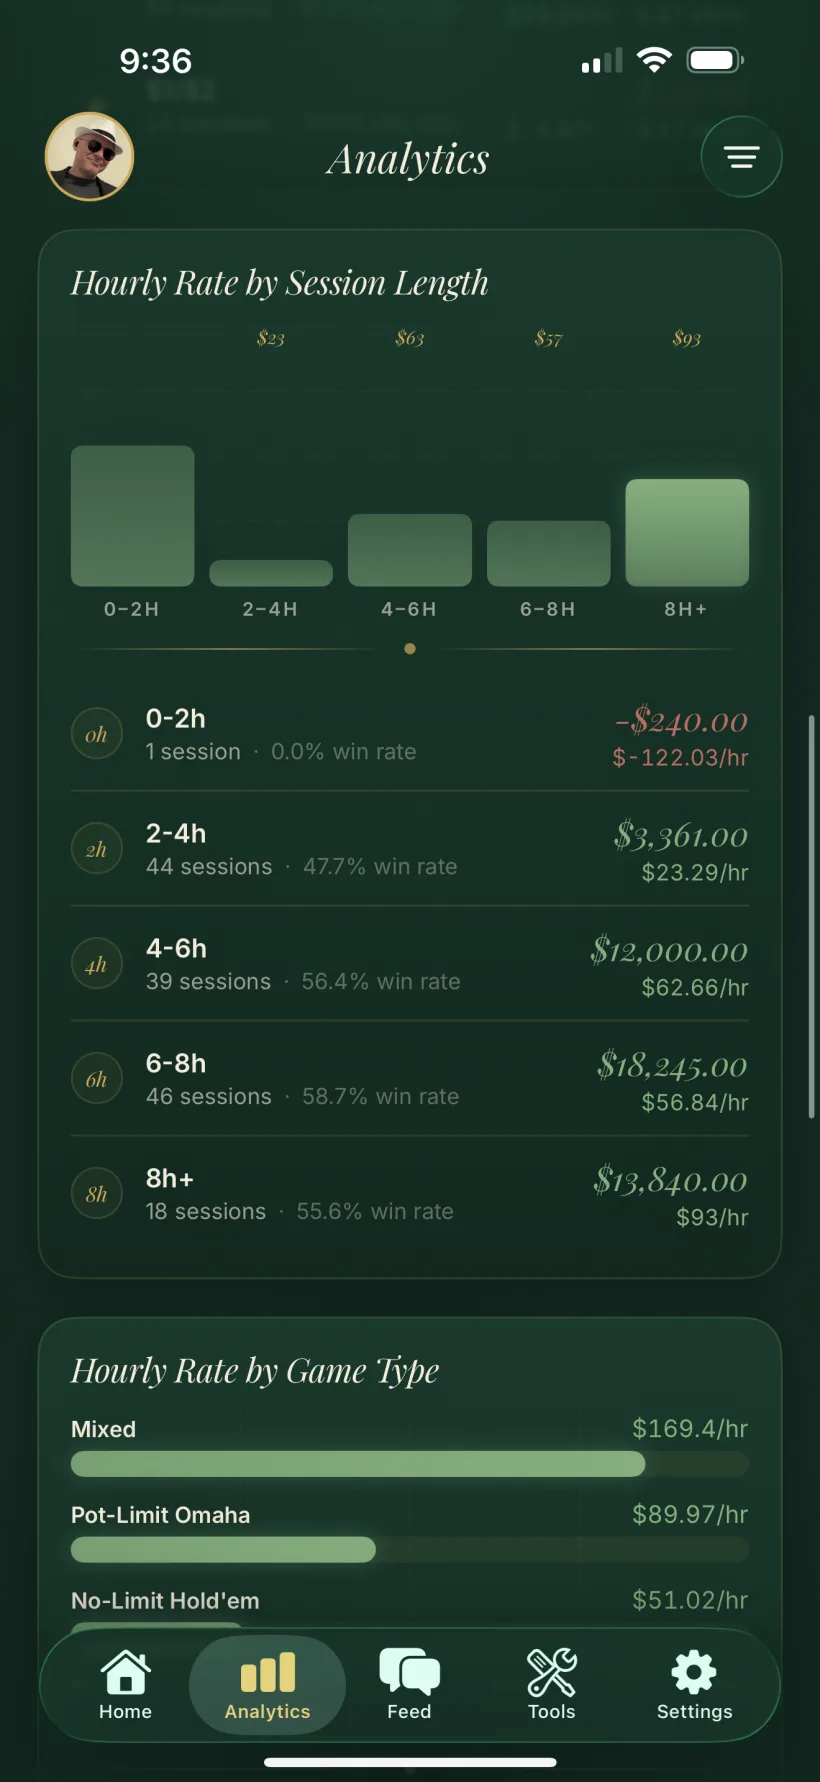
Seven breakdowns. By stake, game type, venue, weekday, session length, and pre-session mood — each ranked by win rate.
Day-by-time heatmap. A 7-day by 6-hour grid that shows when you actually play your best poker.
Filter the window. Scope any view by time range and game format — cash, MTT, SNG, or home game.
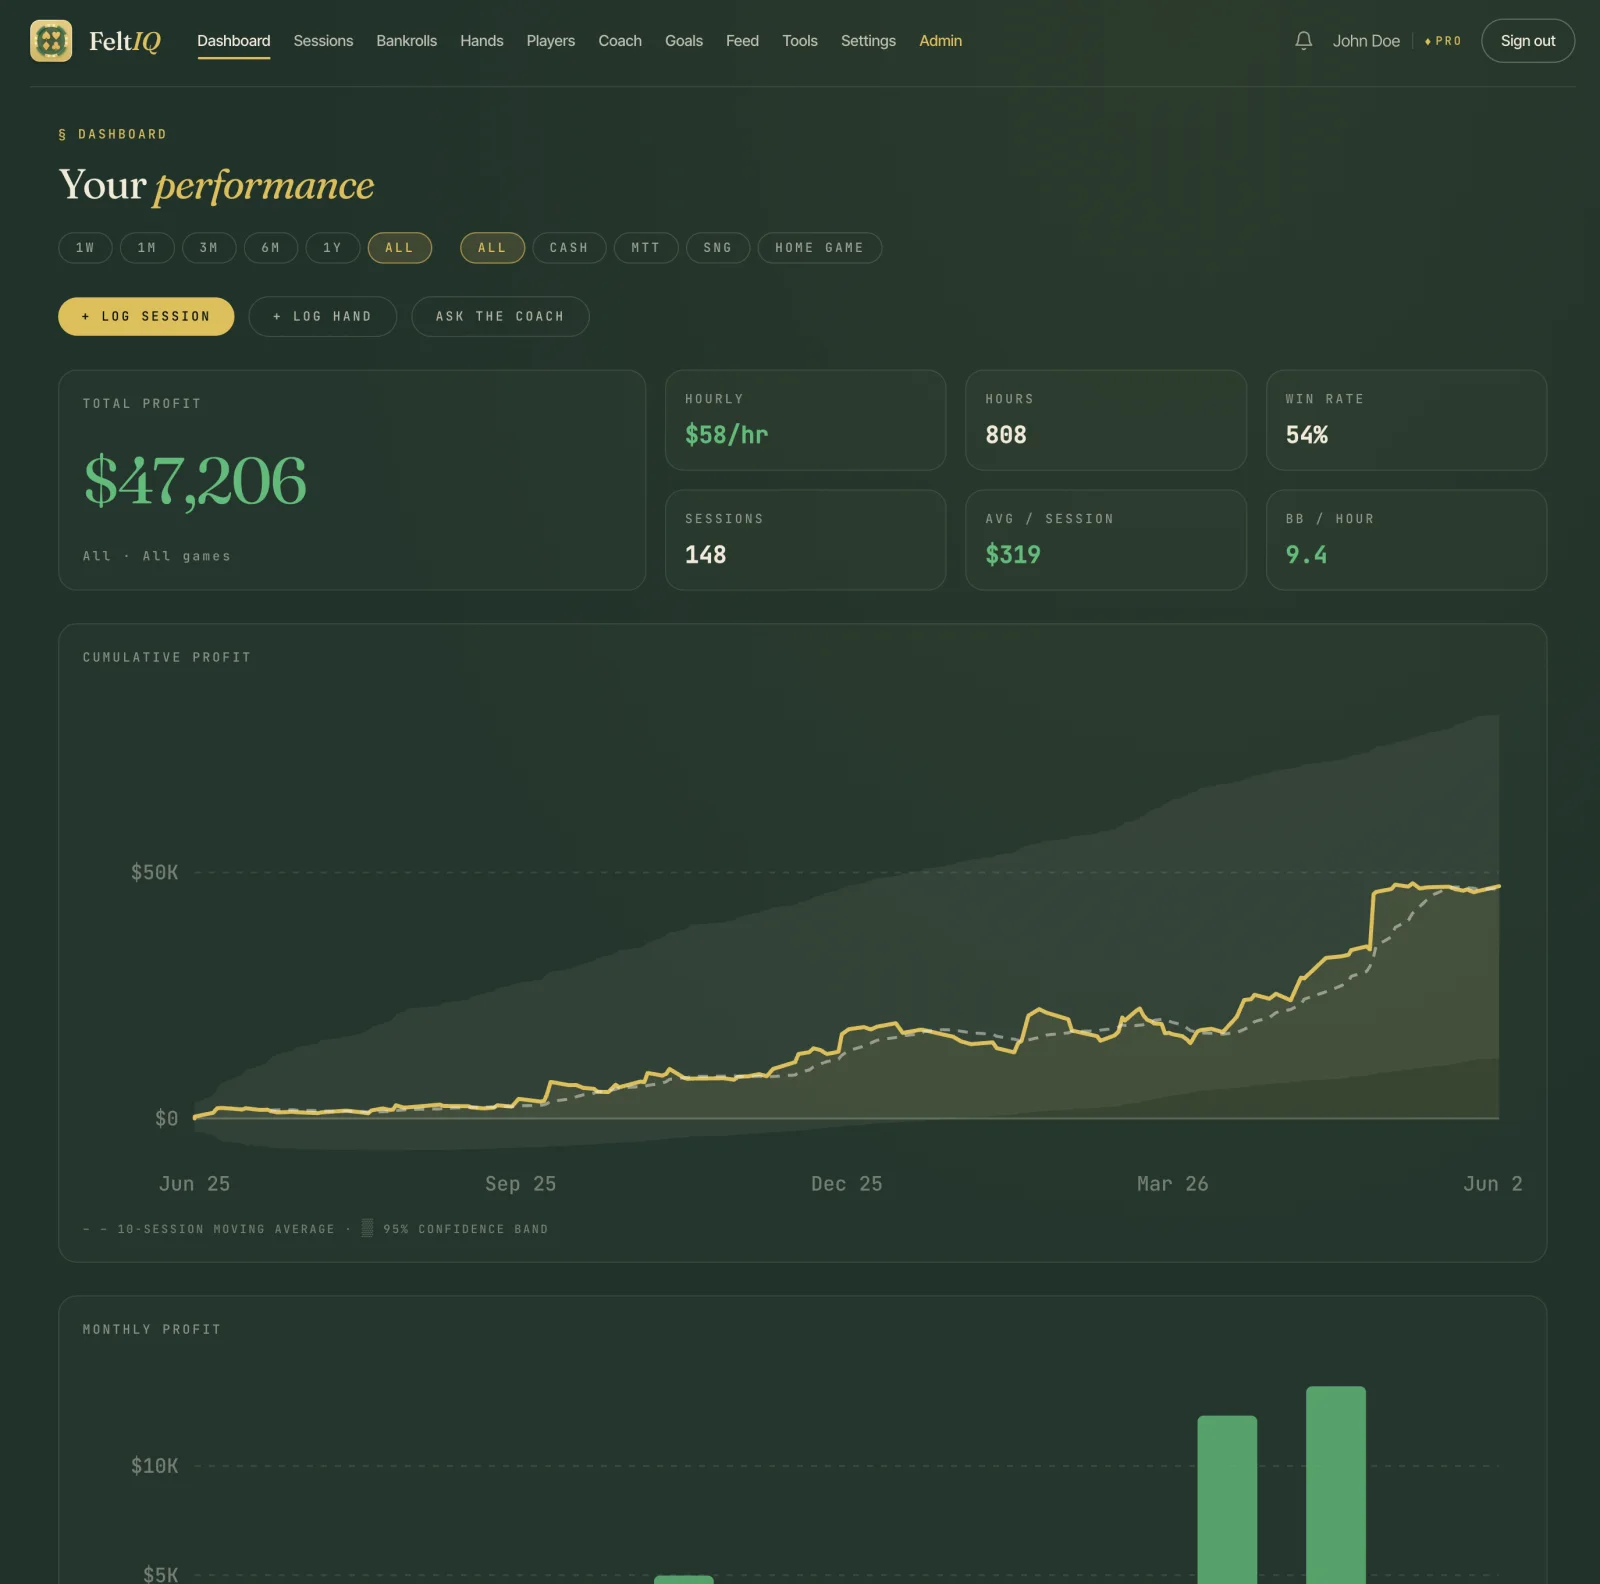
See your graph the way pros read it.
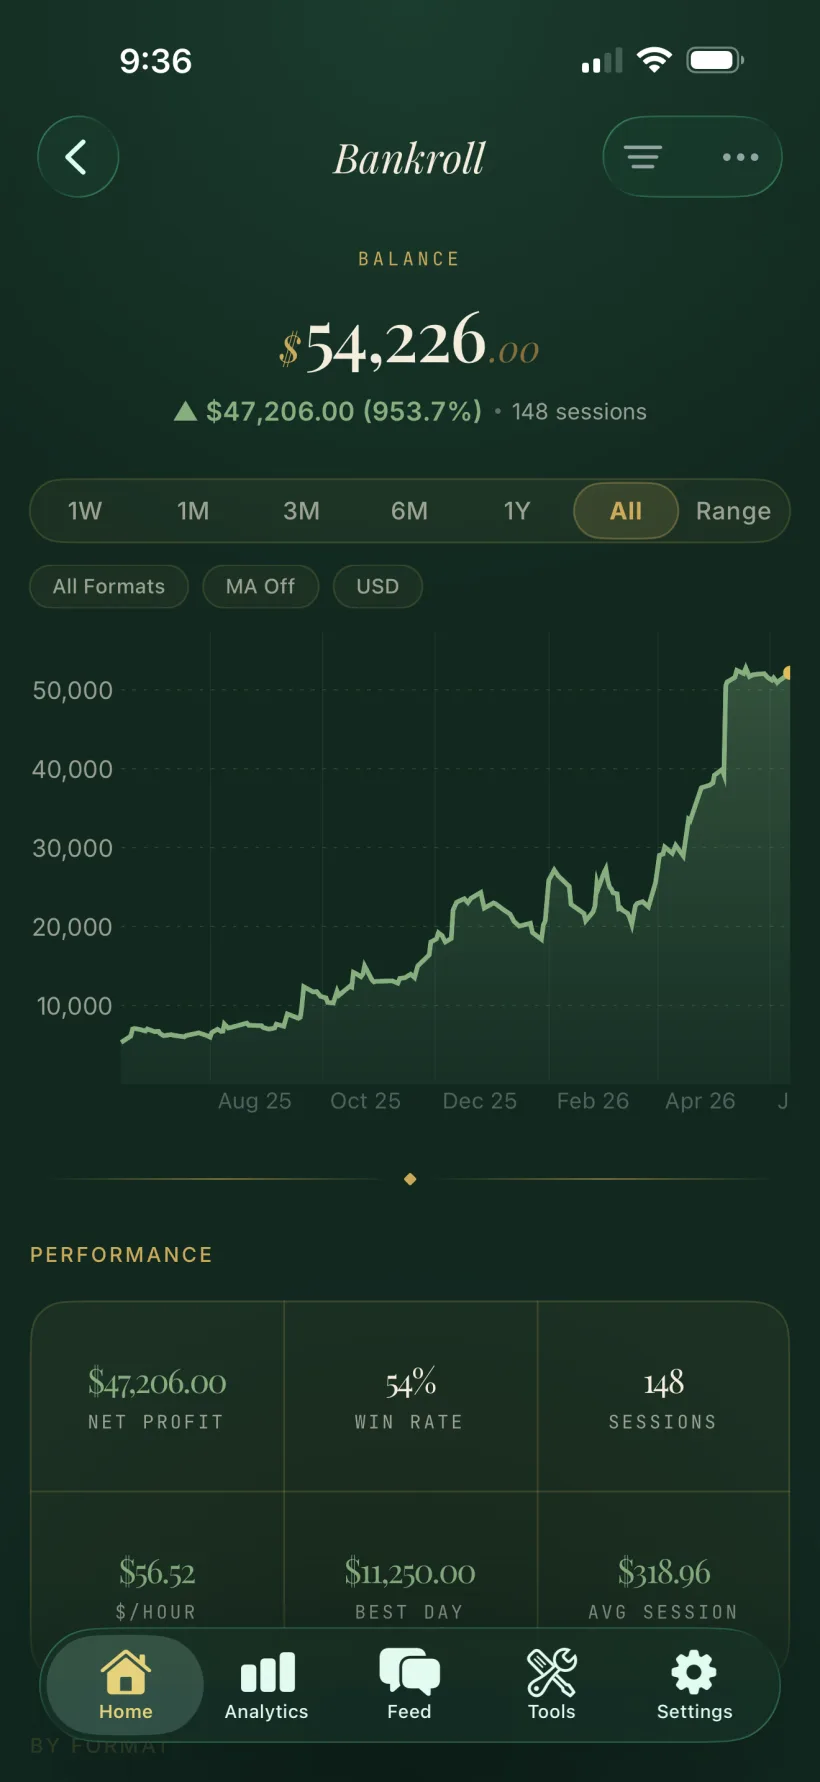
Cumulative profit. Your lifetime graph, anchored at zero, green above water and red below.
Moving average. A 10-session trend line cuts through the noise of any single night.
95% confidence band. Once you have a sample, see the range a win rate like yours can realistically swing through.
Know your downswing before it knows you.
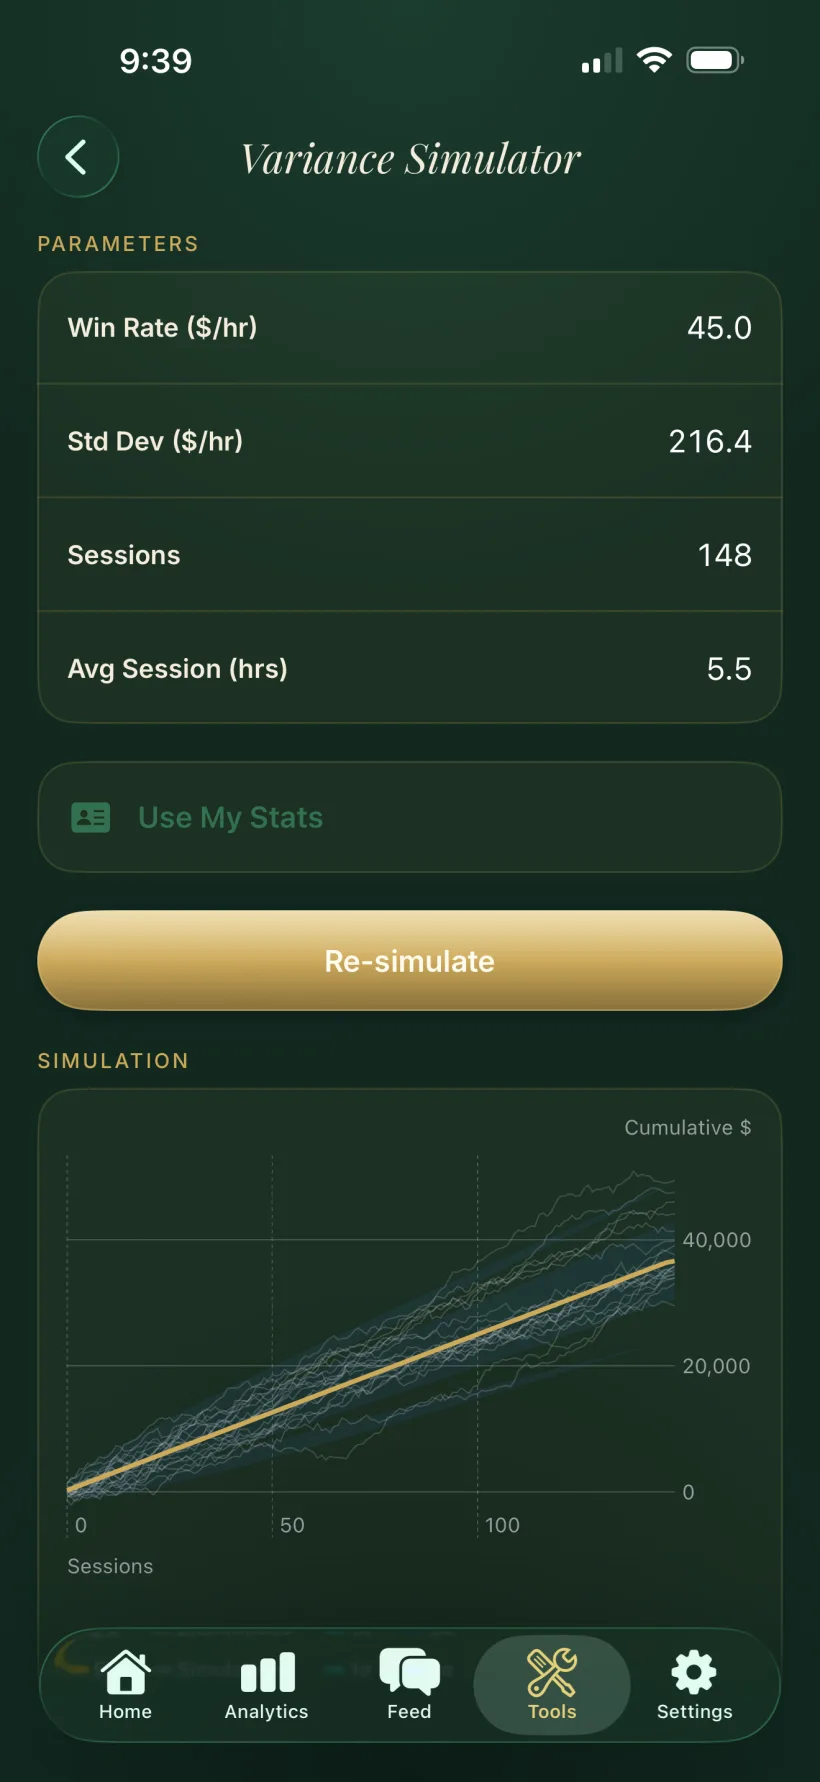
Variance, measured. Mean result and standard deviation across your real sample, not a generic estimate.
Risk of ruin. The probability of busting your current bankroll, given your win rate and swings.
Bankroll target. The roll you would need to drop risk of ruin to 5% — a concrete number to climb toward.
| Capability | Free | Pro | Elite |
|---|---|---|---|
| Core KPIs & profit charts | ✓ | ✓ | ✓ |
| Analytics history | 3 months | Unlimited | Unlimited |
| Breakdowns & heatmap | — | ✓ | ✓ |
| Moving average & confidence band | — | ✓ | ✓ |
| Risk of ruin & variance | — | ✓ | ✓ |
| Extended time ranges (6m · 1y) | — | ✓ | ✓ |
Every plan starts with a 7-day Pro trial — no credit card. Compare all plans →
Keep reading.
The rest of the tableLedger
Log a session in seconds — offline-first, any stake, any game.
Read →IIICoach
Claude grades a session and shows you exactly where you leak.
Read →IVJournal
Log the hand that cost you sleep — export it to your solver.
Read →VRail
Share session recaps, keep notes on the regulars, build a streak.
Read →Stop guessing. Start knowing.
The full analytics suite — breakdowns, heatmaps, and risk modeling — unlocks on Pro, starting with a 7-day free trial.